Hooray! You’ve finally set up your Google Analytics 4 (GA4) account… but, now what?
In the final part of our series, we’ll explore how to make the most of your GA4 data, including setting up custom reports, using machine learning to uncover insights and integrating with other marketing tools. We’ll also discuss how to adapt your reporting and analysis to take advantage of the new features and capabilities of GA4.
Before we get started, be sure to check out parts one through four of the series for a more comprehensive look at GA4 migration:
Part 1 – What You Need to Know Before It’s Gone for Good
Part 2 – What You Need to Do Before It’s Gone for Good
Part 3 – The Sun is Rising on GA4
Part 4 – Best Practices for Migrating to GA4
Are you ready to get started? Keep reading!
Set up customized GA4 reports
As we noted a few times during the series, before you start setting up reports in GA4, it is important to complete an audit of your Universal Analytics (UA) account. Determine which reports you need, what reporting might not be of service anymore and if there are any blind spots where a new report can shed some much-needed light.
You’ll also want to take stock of your marketing goals to create reports that will give you actionable data and insights, ultimately enhancing your current marketing strategy. For example, if your goal is to drive traffic to your website, you’ll want to see how much traffic you’re getting and from which sources. However, if your goal is to increase sales of a specific product or service, then you’ll want to add an extra layer of which sources produce the highest close (sale) rate.
To set up customized reports, you’ll need to access the report builder. The process is detailed in Google’s support documents, but here are some quick notes to help you get started.
Create customized reporting
You can start with one of GA4’s standard reports and personalize the data pull to deliver the tracking you need. Start by either editing or making a copy of an existing report. If you make a copy, you can keep the original report, as well as alter the contents for another way to look at the data. Here are a few options that GA4 offers:
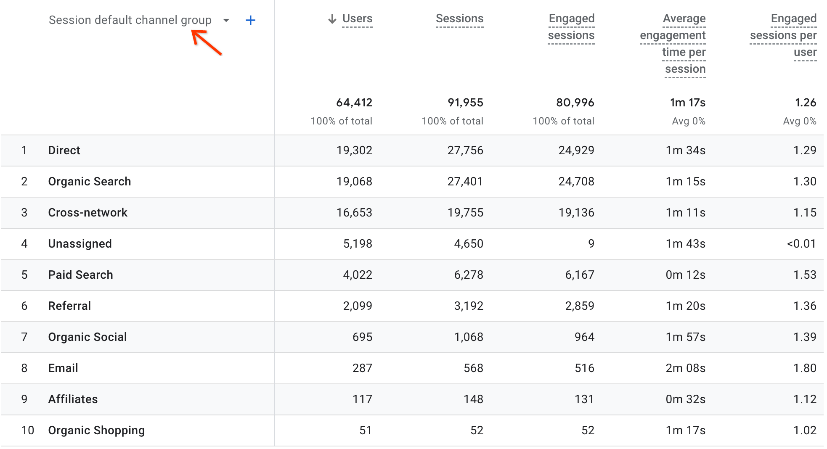
- Change dimensions – You can add or remove dimensions from the y-axis (leftmost column). Google includes options here such as Direct, Organic Search, Cross-network, Paid Search, Referral, Organic Social, Email, Affiliates and more. This will give you additional data for a comprehensive look or the ability to simplify a report you already like.
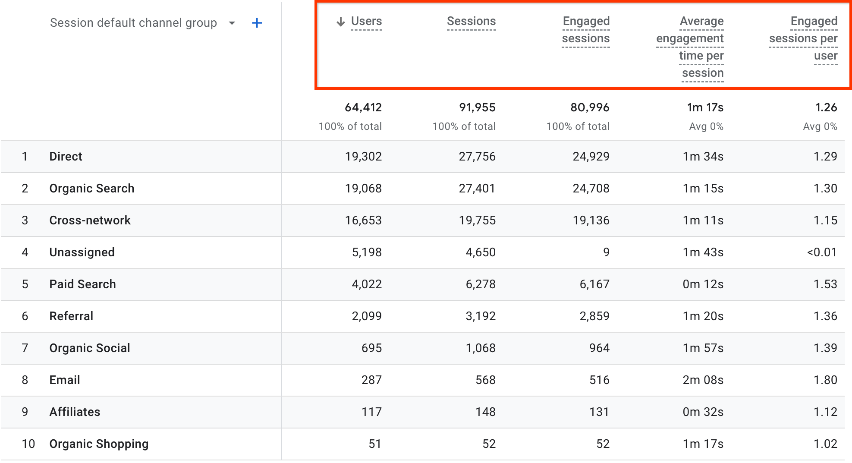
- Change metrics – The same as changing dimensions, changing metrics across the x-access (horizontally across the top) will either add or remove data points that are displayed across the report. Some options here include Users, Sessions, Engaged Sessions and more.
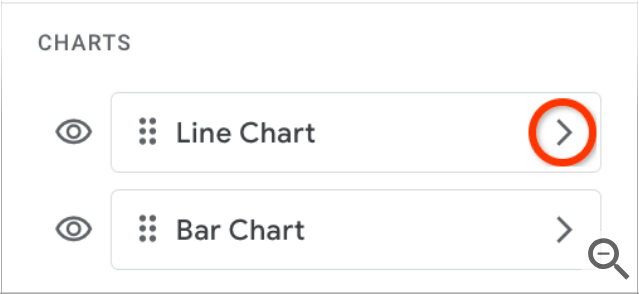
- Change charts – Want to see your data in a different format? Change the chart to choose from styles including bar chart, scatter chart or line chart. For marketers, this is fantastic for presentations, giving us the ability to show our important data in a digestible format.
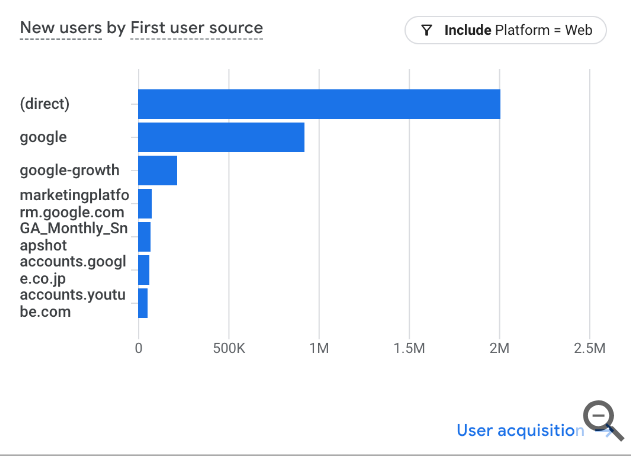
- Save a filter – You can choose to include or exclude specific data sets. For example, if you have multiple locations, a filter will allow you to look at one or a group of locations, or you can look at all locations at once.
- Summary card – Exactly as it sounds, creating a summary card provides a snapshot of a specific group of dimensions and metrics. You can choose which dimensions, metrics, charts and filters you want, and then save the card so that you can access this specific data again.
At each step, you’ll want to hit “Apply” at the bottom to make sure that GA4 saves the choices you’ve made. With all the dimensions, metrics and filters that can be tapped, there are a host of customized reports that can be created within the report builder. This is even more true with integrations, but we’ll get to that in a bit.
Report navigation
Not only can you customize reports, but you can organize reports into groups or “collections.” GA4 already provides User and Life Cycle collections, but users can create collections based on any number of options including conversions, demographic details, ecommerce purchases, events, in-app purchases, pages and screens, publisher ads and more.
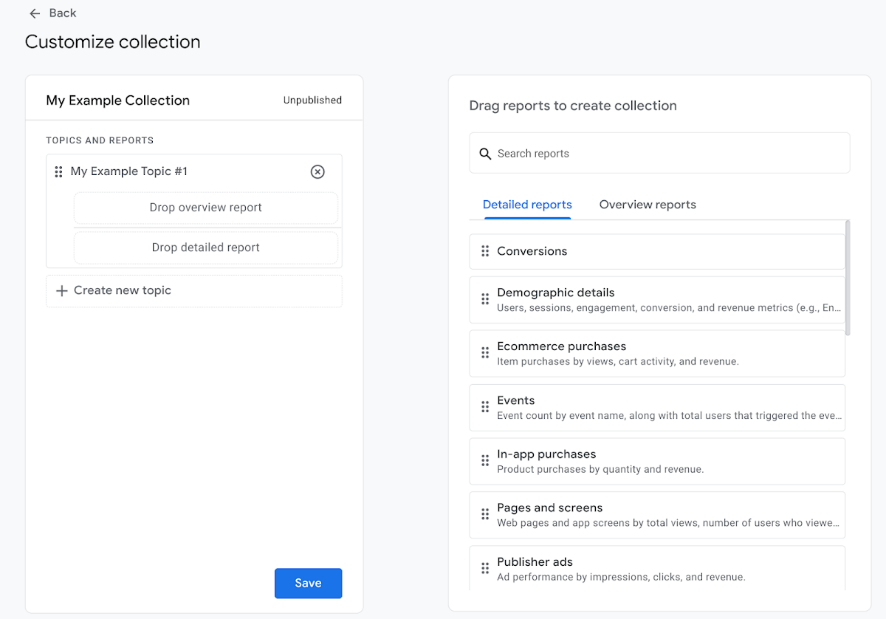
To create a collection, go to the Library, click “Create new collection,” select “Blank” and then enter the collection name and topic you want. Collections can be customized by many factors including conversions, purchases, audience demographics, app activity and more. Be sure to save your progress. If you want to make the collection available to other users, go to the Library and Publish your collection card.
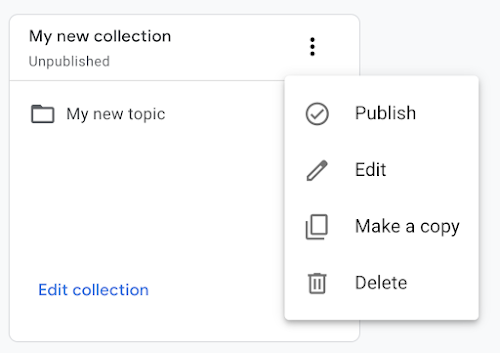
If you aren’t sure where to start, GA4 offers a couple of pre-set-up collections, in addition to User and Life Cycle which are already available. Admins can add App Developer which provides insights on the in-app user experience, and Games which focuses on app-based games.
Machine learning features
Machine learning (ML) is a form of artificial intelligence (AI), where the program uses past data and algorithms to make decisions and solve problems. Google has integrated two areas of ML into GA4 to help marketers and brands manage campaigns.
Predictive metrics
This feature looks at the current data set to forecast future behavior of customers. Predictive metrics that are available are described by Google as:
- Purchase probability – The probability that a user who was active in the last 28 days will log a specific conversion event within the next seven days.
- Churn probability – The probability that a user who was active on your app or site within the last seven days will not be active within the next seven days.
- Predicted revenue – The revenue expected from all purchase conversions within the next 28 days from a user who was active in the last 28 days.
Predictive audiences
Predictive audiences are based on the predictive metrics that are able to be collected. Being able to use this function is predicated on predictive metrics being in play. The ML identifies people in the conditions of “Most Likely,” Least Likely,” or a custom percentage range. So, for example, marketers can identify audiences that are most likely to make a purchase, most likely to churn, least likely to purchase and so on.
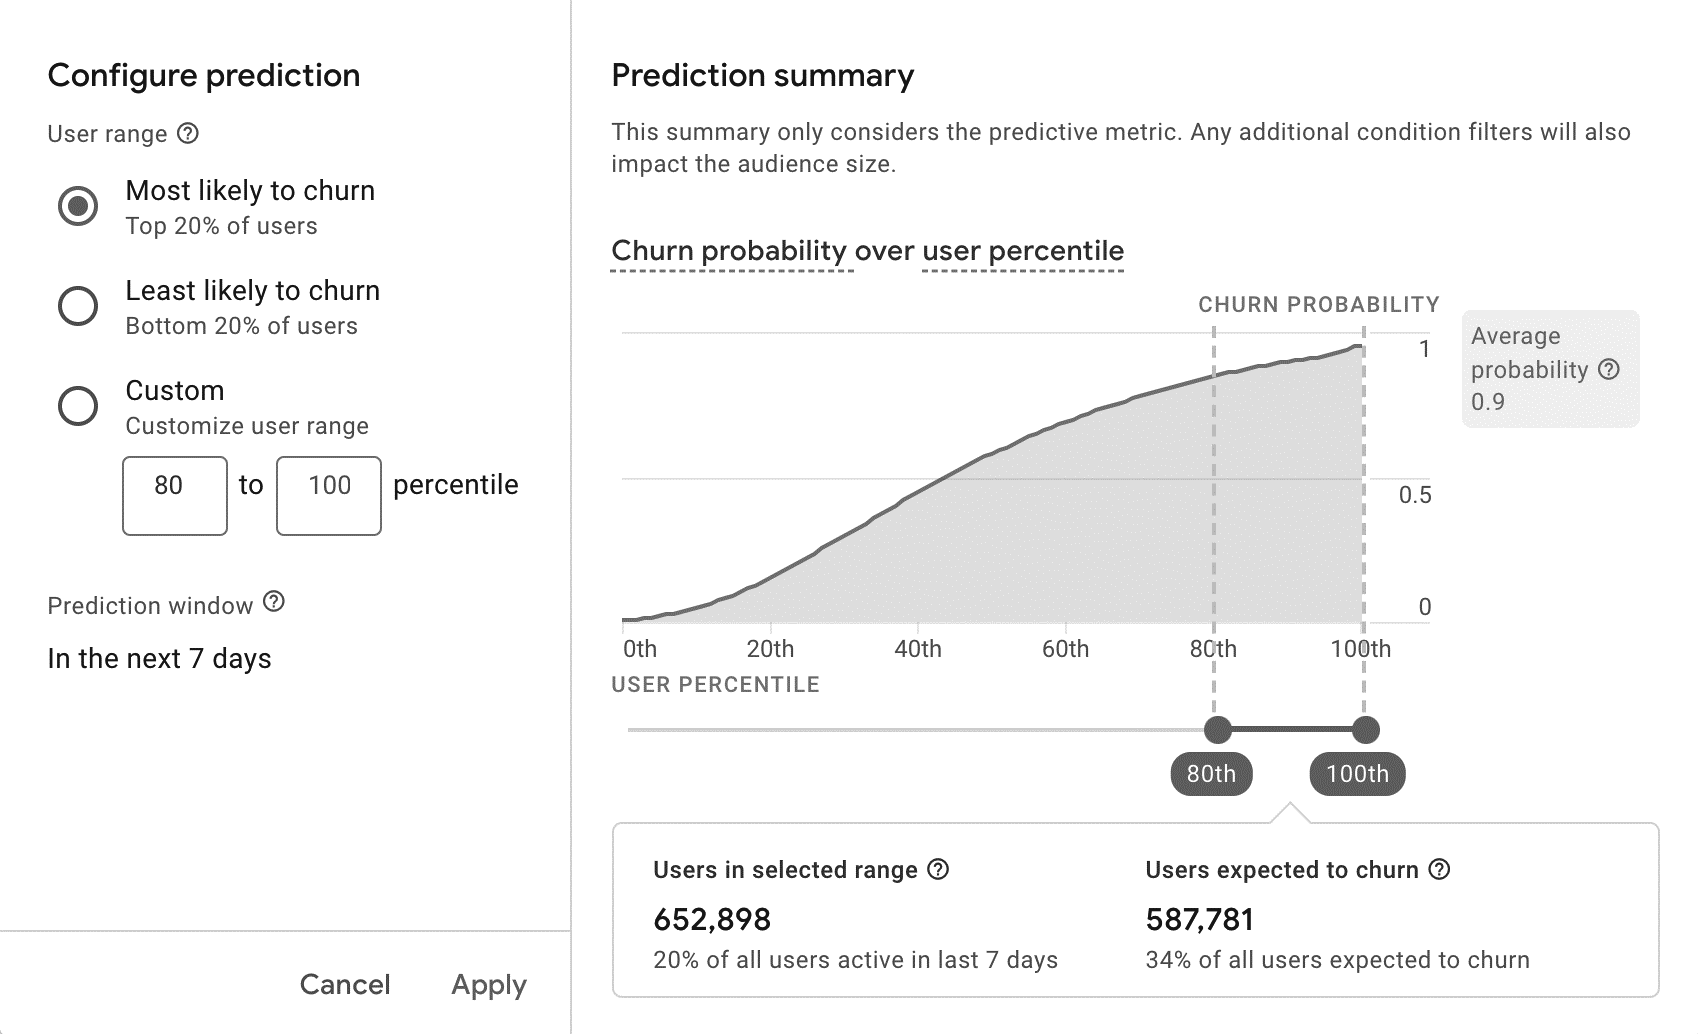
Brands can use this information to:
- Advertise products – Target those in the middle ranges of the purchasing journey to keep the brand top-of-mind, introduce new products or deliver valuable content.
- Remarket – Reach out to those with a high probability (most likely to purchase) to seal the deal or even extend a special offer. Google’s predictive programming dives deep into consumer behaviors and patterns to suggest audience members on the brink of a buying decision. This is particularly effective for those who have placed an item in the cart but have not completed the purchase.
- Re-engagement – Target those most likely to churn and get them thinking about your brand once again. Google suggests serving a reminder of value in terms of product variety, quality, price, convenience or return policy. Brands might also choose to deliver a special offer here to entice the target audience back.
Integrating other marketing tools
Did you know that you can integrate other tools into the GA4 ecosystem? Once completed, you can then access data from those tools and include it in your reporting. Some available integrations noted by MARTECH are:
- Google Ads
- BigQuery
- Display & Video 360
- Google Ad Manager
- Google Optimize
- Salesforce Marketing Cloud
- Search Console
- Play integration
This is particularly advantageous for those with ecommerce tools such as Shopify, OpenCart, Amazon Webstore, Magento and WooCommerce.
eCommerce Fastlane notes that a brand can connect its ecommerce platform which offers built-in integration to GA4 by entering the property ID. Once set up, the platform can then send data to the brand’s GA4 property, which is both convenient and important for reporting purposes.
This will then allow the brand to use custom dimensions and metrics and generate reporting specific to performance data provided by the sales platform, set up conversion tracking, use GA4’s ecommerce dashboards and gain important insights right from its own sales tool.
You’re all set
When we started this series, we talked about the sun setting on UA. While change is hard, we think the new system will be advantageous for both brands and marketing teams. Now, the sun has officially risen on GA4 and it’s a brand-new day. With so many features, available data collection points, customized reports, ML capabilities and marketing tool integrations, the new system will provide marketers with even more actionable insights than before! So, what now? Start using GA4 to its maximum capability.
Connect with the team at Beyond Fifteen to learn more about how our marketing experts can help you make the most of your GA4 account.


